📊 Data Detective
🕹️ How to Play
-
Study the chart or graph carefully.
-
Read the question about the data.
-
Pick the correct answer!
Loading Data Detective...
🧩 Skills You'll Build
📖 About This Game
Data Detective turns young learners into chart-reading sleuths! Each case presents a pictograph or bar chart with hidden clues in the data. Answer questions about the most, the least, totals, and differences to crack each case. Progress from simple emoji pictographs to multi-dataset bar charts as your detective skills grow.
Learning outcomes: Data Analysis, Charts, and Problem Solving development through engaging, self-paced gameplay.
What Your Child Will Learn
Students learn to extract meaningful information from pictographs and bar charts — reading individual values, identifying the maximum and minimum, computing totals and differences, and interpreting what the data means in context. By the multi-dataset bar charts, students can compare two groups at once and identify trends. These are the data literacy skills tested on every standardized mathematics assessment and used every day in careers from medicine to journalism.
Skills Developed in Detail
- Data Analysis: Reading a chart isn’t passive — students must identify which data point answers the question, which requires understanding what the axes represent and what the question is actually asking.
- Charts: Exposure to both pictographs and bar charts gives students experience with two of the three core chart types introduced in elementary school (the third being line graphs), building flexible graphical literacy.
- Statistics: Questions about “most,” “least,” “total,” and “difference” build the foundational statistical thinking that leads to mean, median, and range in later grades.
- Problem Solving: Many chart questions require multi-step reasoning — “How many more apples than bananas?” requires finding both values and then subtracting — which develops practical arithmetic application skills.
Tips for Parents
Point out graphs in real life — weather forecasts, sports standings, nutrition labels, news articles. Ask your child to read the chart and explain what it shows in their own words, then what question it answers. The habit of asking “What is this chart trying to tell me, and does it actually tell me that?” is a critical media literacy skill that Data Detective directly builds.
How Teachers Can Use This in the Classroom
Data Detective maps well to grades 2–4 data and graphing units. Use the pictograph levels as an introduction to the game before students have studied bar charts, then advance to bar charts as that lesson is taught. The case-file framing makes it engaging for partner work — students can “solve the case” together, discussing their reasoning before submitting. The game also works as a review before standardized testing.
Curriculum Alignment
- CCSS.MATH.CONTENT.2.MD.D.10 — Draw a picture graph and a bar graph to represent a data set with up to four categories
- CCSS.MATH.CONTENT.3.MD.B.3 — Draw a scaled picture graph and a scaled bar graph to represent a data set with several categories
- CCSS.MATH.CONTENT.4.MD.B.4 — Make a line plot to display a data set of measurements in fractions of a unit
Why It Matters
Data literacy — the ability to read, interpret, and question graphical information — is increasingly essential in a world where data shapes public health decisions, political campaigns, and scientific research. Children who can critically read a chart rather than passively accept it are better equipped to evaluate the information they encounter throughout their lives. Starting data education in elementary school gives students years to build the habits of careful reading and healthy skepticism that distinguish informed citizens.
More Math & Numbers Games
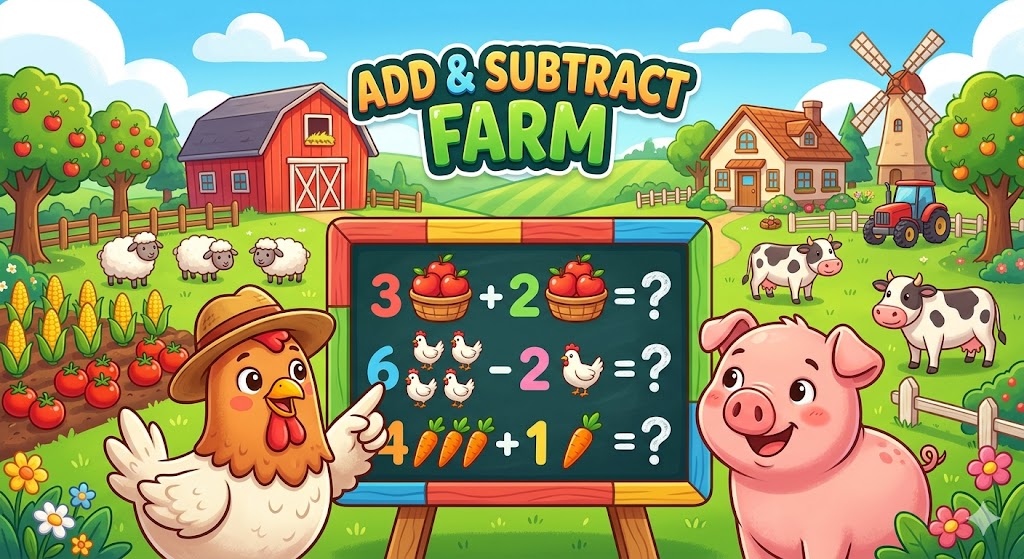
Add & Subtract Farm
Learn addition and subtraction through farm-themed visual puzzles. For ages 5-7, builds number sense and word problem skills. 10-15 min.

Algebra Adventurer
Master algebra by solving linear equations to build bridges across 5 worlds. For ages 11-15, builds problem solving and mathematical reasoning. 15-20 min.
Coin Collector
Practice money math by collecting coins from pennies to quarters. For ages 5-7, builds addition and place value skills. 10-15 min.
Coordinate Conquest
Explore the coordinate plane by plotting points across all four quadrants. For ages 11-15, builds graphing and linear equation skills. 15-20 min.